Process mapping
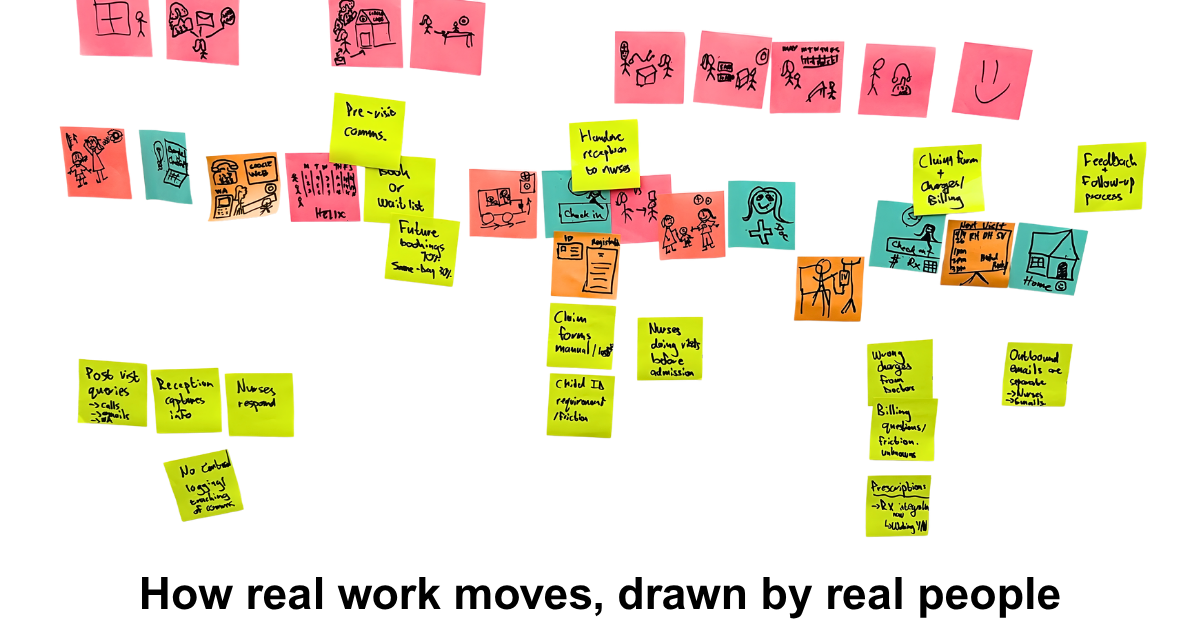
We go back to the drawing board, literally.
Every organisation run on processes, whether they are documented or not. By surfacing the steps, identifying the friction, and aligning the teams around a unified way of work we increase both team effectiveness and efficiency. Improvement starts with truth. Capture how work really runs, identify waste, and set a calm sequence for change.
Expect shorter cycle times, fewer handovers, and rules that live where work lives.
Our Approach
How we diagnose, design, and implement change.
Discover
Interviews, facilitate, map process, system and data flows
Design
Current state, future state, prioritised fixes
Implement
Visible changes and improvements, SOPs, measurement
Outcomes
What success looks like in numbers and maps.
Clarity
A shared organisational understanding of how work happens
Flow
Fewer touches, cleaner handovers, faster cycle time
Progress
Quick wins, sustainable changes, aligned teams
Measure twice, improve once
What process mapping is
Process mapping is a plain picture of how work moves from start to end. It shows steps, decisions, roles, systems, and artefacts. The point is not pretty diagrams. The point is shared reality. Once people agree on what happens today, change becomes simple and safe. Mapping is the foundation for automation, better reporting, and reliable handovers.
Suggested visual
A one-page swim lane map of a simple “Lead to Invoice” flow across Sales, Ops, and Finance. Labels short. Neutral colours.
Many hands, one map
Who it is for and when to use it
A shared view beats a thousand opinions. Good maps align leaders, managers, and frontline doers. Founders and COOs get one truth. Ops and RevOps use it to set playbooks. Finance and compliance see traceability. Product and data teams get cleaner inputs. Use mapping when you are scaling, changing tools, adding a product, or when work feels slow and messy.
Where there’s smoke, there’s friction
Signs you need this
Spot the signals that mapping will help:
- People ask where to put things or who does what
- Work bounces between teams and returns half done
- The same questions land on Slack every week
- Reports do not match what the frontline sees
- Items get stuck when one person is away
- Customers feel the wait even if dashboards look green
- Sales cycles take longer than expected
- Leads are lost with nobody understanding why
- Work stalls when someone is away; cross-cover is unclear
- Handover chatter signals blame: “from Sales,” “Ops didn’t do X”
What gets measured gets mended
Outcomes and success metrics
1
Cycle time
Start to finish, not just time in a queue
2
Success rate between stage
Improved sales conversion
3
First-pass completion
Done right without rework
4
Handover quality
Clear entry and exit criteria
5
Customer satisfaction
Happy clients that stay and recommend you to others
These are practical numbers of teams can improve in weeks, not quarters.
Slow is smooth, smooth is fast
How We Do It: A Step-by-Step Method
1
Discover
gather real work paths through focus-group interviews, process mapping exercises, and system traces.
2
Map the current state
capture the right level of detail on one page per core process. Steps, decisions, roles, systems, artefacts, SLAs.
3
Validate with the team
run a live walkthrough to correct gaps, add edge cases, and agree on today’s truth.
4
Find waste and risk
mark queues, unclear owners, duplicate tools, manual re entry, and failure demand.
5
Prioritise fixes
score by impact, effort, and risk. Select near-term wins and one or two bigger moves.
6
Design the future state
redraw with fewer steps, clean handovers, and the right system moments.
7
Quick wins and runbook
lock three to five changes for the next month. Write simple SOPs where the work lives.
Tools, not trophies
What you get
Current and future state maps
Backlog with owners, effort, impact, and dates
Versioned SOPs used inside tools
Handover checklists with entry and exit rules
Simple trackers for cycle time, blockers, and first pass.
Right people in the right seats
Who belongs on the process team
Your Team
Process owners
Frontline doers
Decision maker
Our Team
Facilitator
Process analyst
Solutions architect
Tools: A whiteboard, some sticky notes and a few markers or digital tool for mapping, a documentation hub for artefacts, and the work system for checklists.
A steady drum beats a loud cymbal
Timeline and effort
| Week | Activities |
|---|---|
| 1 |
|
| 2 |
|
| 3 |
|
| 4 |
|
Timeline assumes typical complexity. Larger environments may require additional time.
Counter sample
100%
sample counter
3
sample cards
5000+
Large number sample
Show, don’t tell
Proof and next steps
- Handover to same day Rework down 40 percent
- Support response at 92 percent under 2 hours Clear triage rules
- Month end shorter by 3 days Standard inputs and checklists
- Faster sales cycles 2x faster lead to revenue cycles
- Less errors and rework 55% reduction in errors
- Happier, more effective teams eNPS up 1.5× and productivity up 1.5×
Frequently Asked Questions
Common questions we are asked.
Is this the same as automation?
No. Mapping removes waste and clarifies rules, so automation is safe and useful. Automating the wrong thing just creates waste faster.
Do we have to change tools?
Not always. Many wins come from cleaner handovers and clear rules. It depends on how far you want to go with optimisation.
Will people follow the new way?
Yes, if they helped shape it and the rules live where the work lives.
Is this just documentation?
No, the documentation is just a tool to get to implementation. It is living documentation
that drives change, data collection and measurement.
Start where it hurts, fix what you touch
Next steps to begin steady improvement.
Choose one core process. Map it, fix three things, and set up a runbook. When the numbers move, repeat on the next process.
Related Services
Explore how other services connect to this work